

bazel invocation can be found in $(bazel info output_base)/command.profile.gz
It can be viewed in a couple ways:
bazel analyze-profile[path to profile]shows the time-per-phase and the Critical Path- Navigate to https://ui.perfetto.dev and load the profile using your browser for an interactive session.
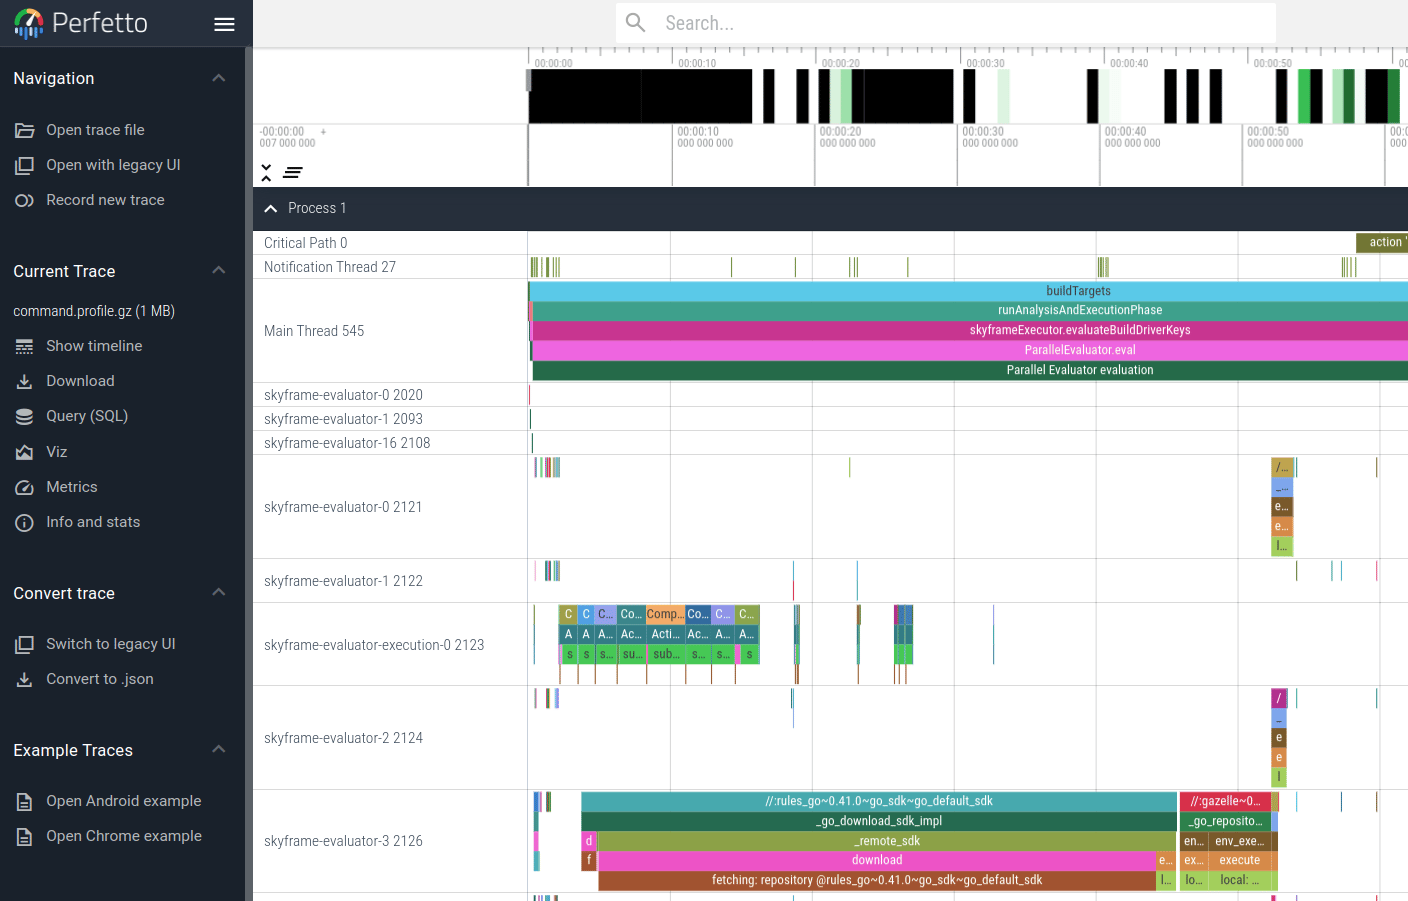
Exercise: let’s understand the example build and test timing by profiling it.
- Run any
bazelcommand in the bazel-examples repository, for example,bazel test //client/... - Open the profile.
- Look for some things we want to improve. Is there anything in the profile we didn’t expect?